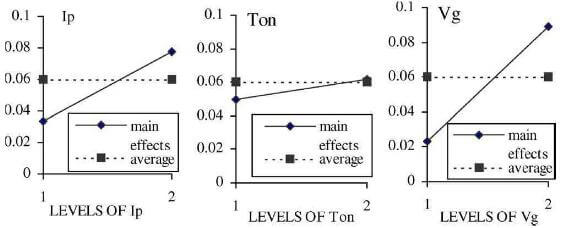
The experimenta results are analysed, to see the main effects and the difference bettween the main effects of level 1 and level 2 of the variables on electrode wear rate and MRR, using the Taguchi software .
In order to estimate the main effects and their differences, first the overall mean value of the observations for the experimental region is calculated. For example, the overall mean of MRR is given by Eq. (1):
Eq.1
The main effect of a parameter level, for example Ip at low level, on MRR is given by Eq (2):

Eq.2
The main effects and their difference associated with the electrode wear rate and MRR are given in Tables 4 and 5, respectively.
THe influence of Iq, over the range of 1-9A, is shown by the increase in main effects of:
(1) EWR from an average value of 0.034-0.078 mg/min.
(2) MRR from an average value of 0.048-0.132 mm3/min.
This increase is because of the rise in input energy rate over the range of Ip.
The change of Ton, from 150 to 750 μs, results in an increase in main effects of:
(1) EWR from an average value of 0.05-0.062 mg/min.
(2) MRR from an average value of 0.087-0.092 mm3/min.
Increase in the input energy, over the range of Ton, is attributed to these variations.
Variation of Vg, over the range of 20-100V, results in the increase in main effects of :
(1) EWR from 0.023 to 0.089 mg/min.
(2) MRR from an average value of 0.028-0.152 mm3/min.
The variation in input energy rate, produced by the change in Vg, is responsible for this behaviour.
Fig.1 shows the multiple linear graphs of main effects and their variation between levels of the parameters in the context of electrode wear rate. The relative slope of linear graphs indicates significance of the parameters. Here, the slope of the graph, showing the influence of Vg on EWR, is more compared to other graphs. Hence Vg is the most significant parameter of EWR, followed by IP and Ton. The “smaller the response the better” is used in the analysis because minimum electrode wear rate is desirable. The overall mean of the main effects is 0.06.

fig.1-multiple-graphs-showing-main-effects-of-variables-on-electrode-wear-rate.