Taguchi techinque overcomes all these drawbacks. The main effect is the average value of the response function at a particular level of a parameter. The effect of a factor level is the deviation it causes from the overall mean response. The Taguchi method is devised for process optimisation and identification of optimal combinations of factors for given responses. The steps involved are:
1. Identify the response functions and the process parameters to be evaluated.
2. Determine the number of levels for the process parameters and possible interaction between them.
3. Select the appropriate orthogonal array and assign the process parameters to the orthogonal array and conduct the experiments accordingly.
4. Analyse the experimental results and select the optimum level of process parameters.
5. Verify the optimal process parameters through a confirmation experiment.
The process parameters chosen for the experiments are: (a) pulse current (Ip), (b) Ton, and (c) gap voltage (Vg) while the response functions are: (a) electrode wear rate and (b) MRR. According to the capability of the commercial EDM machine available and general recommendations of machining conditions for C-C composites the range and the number of levels of the parameters are selected as given in Table 1.

table 1-machining parameters and their levels
The total number of degree of freedom needs to be computed to select an appropriate orthogonal array for the experiments. The degrees of freedom are defined, as the number of comparisons that needs to be made to determine which level is better. For example, a two-level parameter has one degree of freedom. The present analysis does not include the interaction bwtween parameters. Hence, there are three degrees of freedom due to three process variables.
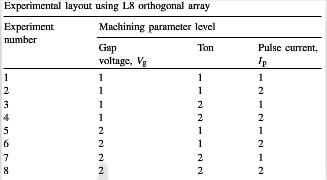
The selection of the orthogonal array is subject to the condition that the degrees of freedom for the orthogonal array should be greater than or at least equal to those for the process parameters. In the present analysis, an L8 orthogonal array with three columns and eight rows is used. This array can handle two-level process parameters and has seven degrees of freedom. Therefore only eight experiments are required to study the entire machining parameters useing the L8 orthogonal array. The experimental layout for the machining parameters using the L8 orthogonal array is shown in Table 2.

talbe-2-experimental-layout-using-L8-orthogonal-array
A statistical analysis of variance is variance is performed to identify the process parameters that are statistically significant. Based ANOVA the optimal combination of the process parameters are predicted.
Experimental procedure:
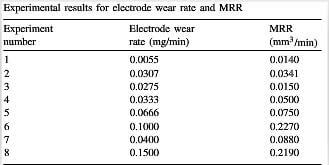
Experiments are perfomed, randomly, accordingly to the L8 orthogonal array, on a C-C plate of size 50mm×20mm×2mm. For each experiment a separate electrode is used. The depth of machining is set at 0.2mm for all experiments. The machining time is noted from the timer of the machine. The electrode wear rate is calculated by weight difference of the electrodes using Librow AGE-220 with 200g capacity with a precision of 0.001g. The diameters of the electrode, before machining, and the hole are measured, using Axiovision systems Axiotech microscope with a CCD camera having a least count of 10 μm, at 5×magnificaiton. A number of readings, at different angular positions of the electrode and hole, are taken. The electrode and hole diameters are represented by the average value of their respective measured diameters. The experimental results for electrode wear rate and MRR, based on the L8 orthogonal array is shown in Table 3.

talbe-3-experimental-results-for-electrode-wear-rate-and-MRR